


Live figures loaded directly from FX Blue
Whenever this page opens, the cards request the latest account figures from FX Blue: growth, monthly return, drawdown, profit factor, trades, win rate and trading period. Every card also links to the complete public profile.
Six checks before trusting any EA
History and continuity
Look for a sufficiently long, continuous record and note restarts, gaps, deposits or account migrations.
Balance versus equity
Compare closed profit with current equity so floating losses are not hidden behind a smooth balance curve.
Drawdown definition
Check both balance and equity drawdown, the measurement period and whether open baskets remain unresolved.
Lot size and exposure
Review lot progression, simultaneous positions, correlated pairs and the largest total exposure.
Broker conditions
Spreads, commission, swaps, execution, leverage and symbol settings can materially change results.
Exact version test
Match the EA version, pair, timeframe and settings, then test the complete workflow on demo first.
Read the account behind the result: balance, equity, drawdown and recovery
Several robots on one account: correlation and shared currency risk
Four systems to examine
Each program has two evidence panels: the latest public account data and a historical Strategy Tester report supplied by its developer. Check the exact version, pair and timeframe before comparing them.

FX Pro Platinum Robot X 2.0
USDJPY H1 Expert Advisor combining technical indicators with grid-based position management.
Backtest · historical simulation
Test period: –
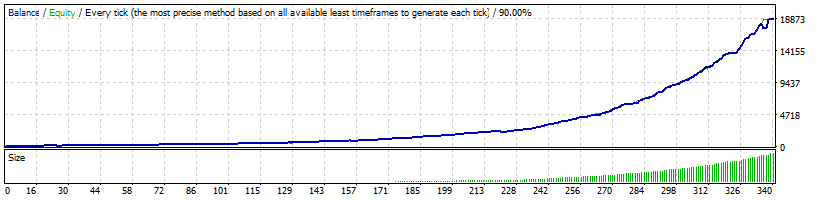
USDJPY · H1 · MT4 · Every tick
- Total trades
- 340
- Profit factor
- 11.06
- Maximal drawdown (amount)
- 3,770.04 (20.50%)
- Initial deposit
- 97.00
- Total net profit
- 18,812.11
- Modelling quality
- 90.00%
- Relative drawdown
- 35.78%
Report values are historical simulations, not LIVE returns or an independent retest. Monetary figures use the report’s account currency; relative drawdown is the largest percentage decline, while the percentage beside maximal drawdown belongs to the largest monetary decline. Fixed spread and 90% modelling quality do not reproduce live execution. The test settings and monitored account may differ.
FX Classic Trader CAD 2.0
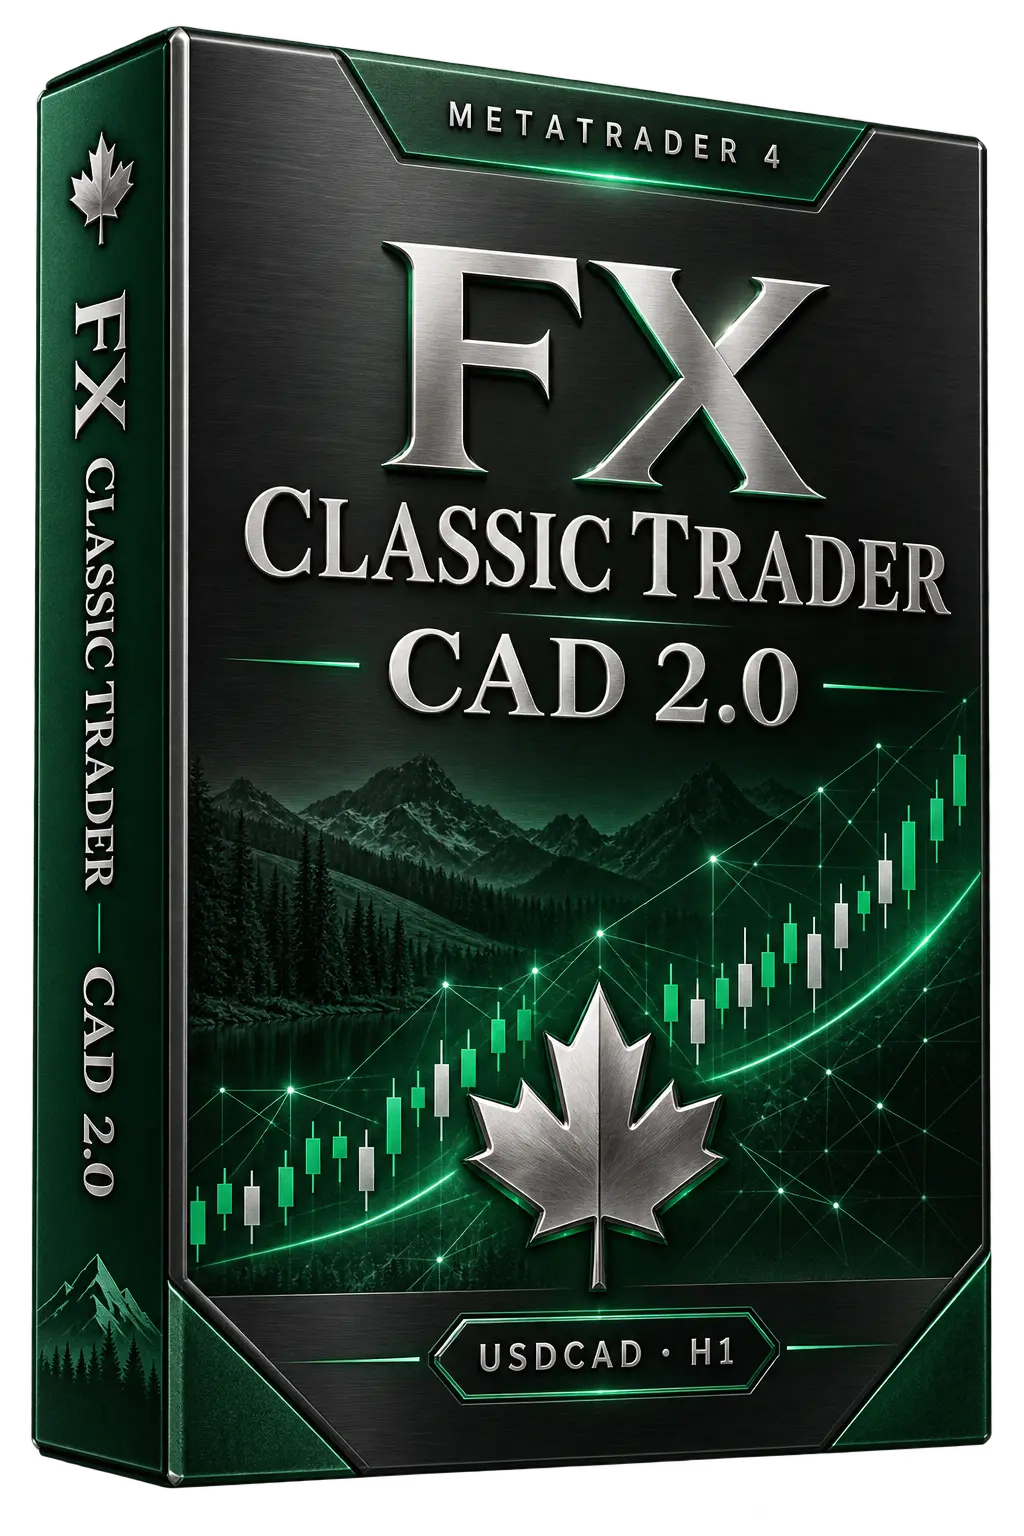
USDCAD H1 Expert Advisor combining mathematical patterns, advanced indicators and automated position management.
Backtest · historical simulation
Test period: –
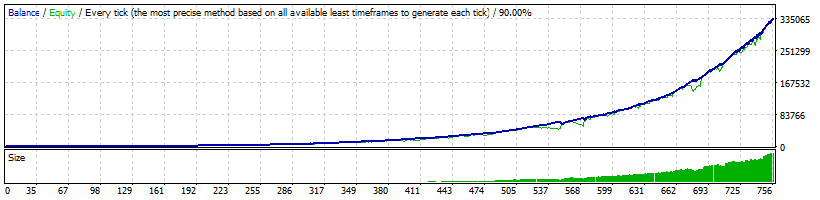
USDCAD · H1 · MT4 · Every tick
- Total trades
- 755
- Profit factor
- 3.19
- Maximal drawdown (amount)
- 25,183.89 (8.98%)
- Initial deposit
- 470.00
- Total net profit
- 334,989.75
- Modelling quality
- 90.00%
- Relative drawdown
- 24.97%
Report values are historical simulations, not LIVE returns or an independent retest. Monetary figures use the report’s account currency; relative drawdown is the largest percentage decline, while the percentage beside maximal drawdown belongs to the largest monetary decline. Fixed spread and 90% modelling quality do not reproduce live execution. The test settings and monitored account may differ.

FX Pro Gold Robot X 5
AUDUSD H4 Expert Advisor combining mathematical market calculations with technical indicators and automated position management.
Backtest · historical simulation
Test period: –
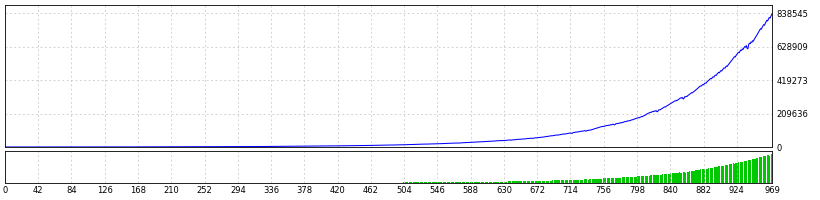
AUDUSD · H4 · MT4 · Every tick
- Total trades
- 969
- Profit factor
- 6.26
- Maximal drawdown (amount)
- 86,438.05 (13.46%)
- Initial deposit
- 195.00
- Total net profit
- 838,350.14
- Modelling quality
- 90.00%
- Relative drawdown
- 19.55%
Report values are historical simulations, not LIVE returns or an independent retest. Monetary figures use the report’s account currency; relative drawdown is the largest percentage decline, while the percentage beside maximal drawdown belongs to the largest monetary decline. Fixed spread and 90% modelling quality do not reproduce live execution. The test settings and monitored account may differ.

Lucky Pips USDJPY 2.0
USDJPY M30 Expert Advisor with configurable stop-loss and take-profit controls plus grid-style trade management.
Backtest · historical simulation
Test period: –
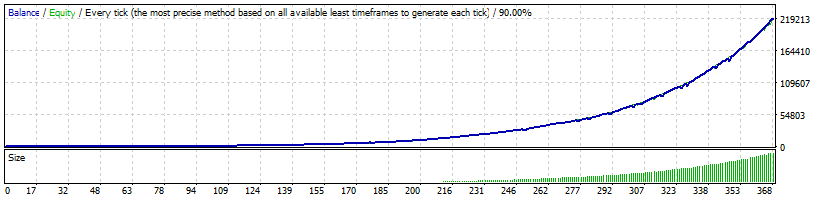
USDJPY · M30 · MT4 · Every tick
- Total trades
- 368
- Profit factor
- 6.71
- Maximal drawdown (amount)
- 19,854.80 (13.05%)
- Initial deposit
- 150.00
- Total net profit
- 219,388.08
- Modelling quality
- 90.00%
- Relative drawdown
- 17.69%
Report values are historical simulations, not LIVE returns or an independent retest. Monetary figures use the report’s account currency; relative drawdown is the largest percentage decline, while the percentage beside maximal drawdown belongs to the largest monetary decline. Fixed spread and 90% modelling quality do not reproduce live execution. The test settings and monitored account may differ.
Side-by-side snapshot
A technical overview before you open the detailed account reports.
| System | Market | Strategy cue | Evidence |
|---|---|---|---|
| FX Pro Platinum Robot X 2.0 | USDJPY · H1 | Mathematical patterns · advanced indicators | Technical indicators · grid management |
| FX Classic Trader CAD 2.0 | USDCAD · H1 | Mathematical patterns · advanced indicators | Public FX Blue account |
| FX Pro Gold Robot X 5 | AUDUSD · H4 | Mathematical logic · indicators | Public FX Blue account |
| Lucky Pips USDJPY 2.0 | USDJPY · M30 | Grid-style management · configurable SL/TP | Public FX Blue account |
Red flags that stop the review
- Screenshot without a public source link
- Return shown without equity and drawdown
- Hidden or unusually old open trades
- Rapidly increasing lot size after losses
- Deposits or withdrawals that distort the curve
- Pair, timeframe or version does not match
A safer evaluation workflow
Verify
Open the public monitoring and identify the account, broker, start date and last update.
Compare
Match the live profile with the stated pair, timeframe, EA version and historical test.
Test
Run the exact version on demo with your broker, spread, symbol names and execution conditions.
Need a broader comparison?
The external premium catalogue groups additional Forex robots, public monitoring, historical tests and product information in one place.
Visit the premium Forex robot catalogue ↗You are leaving MyProfitFactor for an external website. Commercial offers may be available there. If your language is unavailable, the catalogue opens in English.Risk note
Automated trading can lose money quickly, especially when leverage or rising position sizes are involved. Past live or simulated performance does not guarantee future results. Test first and risk only money you can afford to lose.